Alex Loveless and Pete Hodge discuss the challenges of personalising Large Language Models for analysis of your own data.
You knew it was coming, but this doesn’t make it any less disappointing: the March sales target was missed. And so starts the chain of events - email the head of Operations, give them a day to get the numbers together, have the discussions, agree the resulting actions to make up the revenue through the rest of the year, agree the narrative, review next month.
But does all of that ‘busy’ work really need to happen? Was the target really missed or was the target unrealistic? I want to use this example of an everyday business report and how it is interpreted to show how spending a little time understanding the numbers first can save ballooning hours chasing your tail down the line.
This is effectively a toy example with some straightforward analysis, but it’s the first in a series of posts that explores how using time series data provides a superior view when planning and reviewing KPI’s. Here we start with a familiar view and how it might be flawed. Let’s dive in.

Here you see an excerpt from a typical monthly report. Looking at the March revenue figures, Current Year Revenue is over £20k below target. Not good. In fact you can also see that this year’s revenue is even below last year’s. Given this information you’d be forgiven for thinking there is a problem. But before you fire off that email to ops, let’s broaden the context a little to include prior months.
If we look at January and February we can see both targets have been met, and this is confirmed with the Revenue % of Target being positive. However, there is a 7% drop in February. Perhaps this is a downward trend and it’s accelerating? Let’s zoom out again.

Wow, things are getting a little busy here. I wanted to show the figures from 2022 (seen as 2023 Prior Year) for the relevant months and it’s already a sea of numbers. The reality is you would normally have the remaining 2023 months as columns as well! Whilst I know we all have to deal with larger reports and dashboards like this I can feel your eyes glazing over… so. So let’s shift to a graphical representation.

A simple shift like this pays off handsomely and is a step we always take in our analysis. A picture paints a thousand words, right?
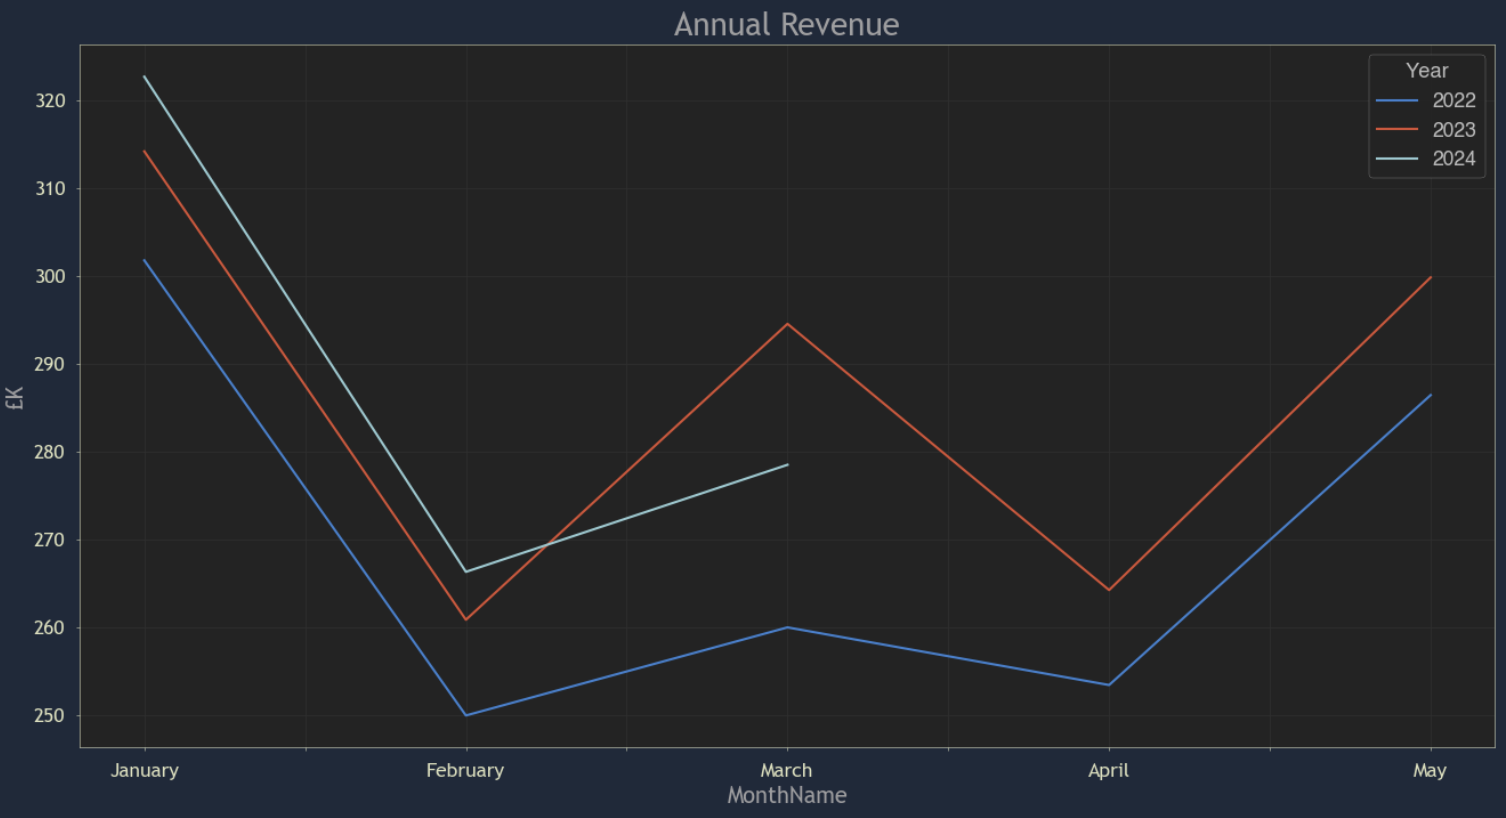
Now it’s easier to see that March 2023 has a steeper line from February than the same in 2024 or 2022. So we have one out of three data points being higher which isn’t enough to make a sound judgement. How to fix this? You guessed it, let’s zoom out again by adding another year.

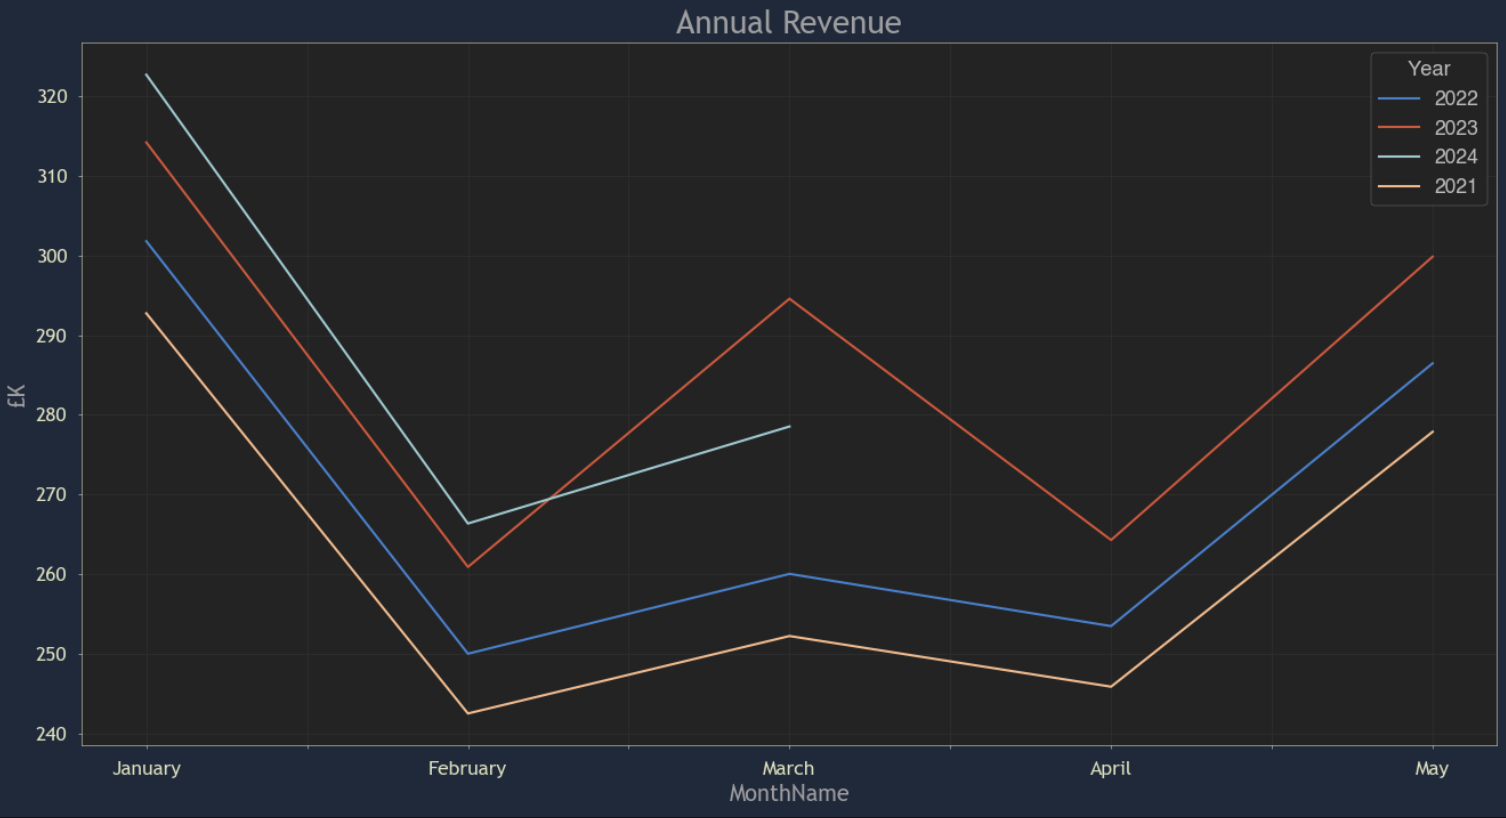
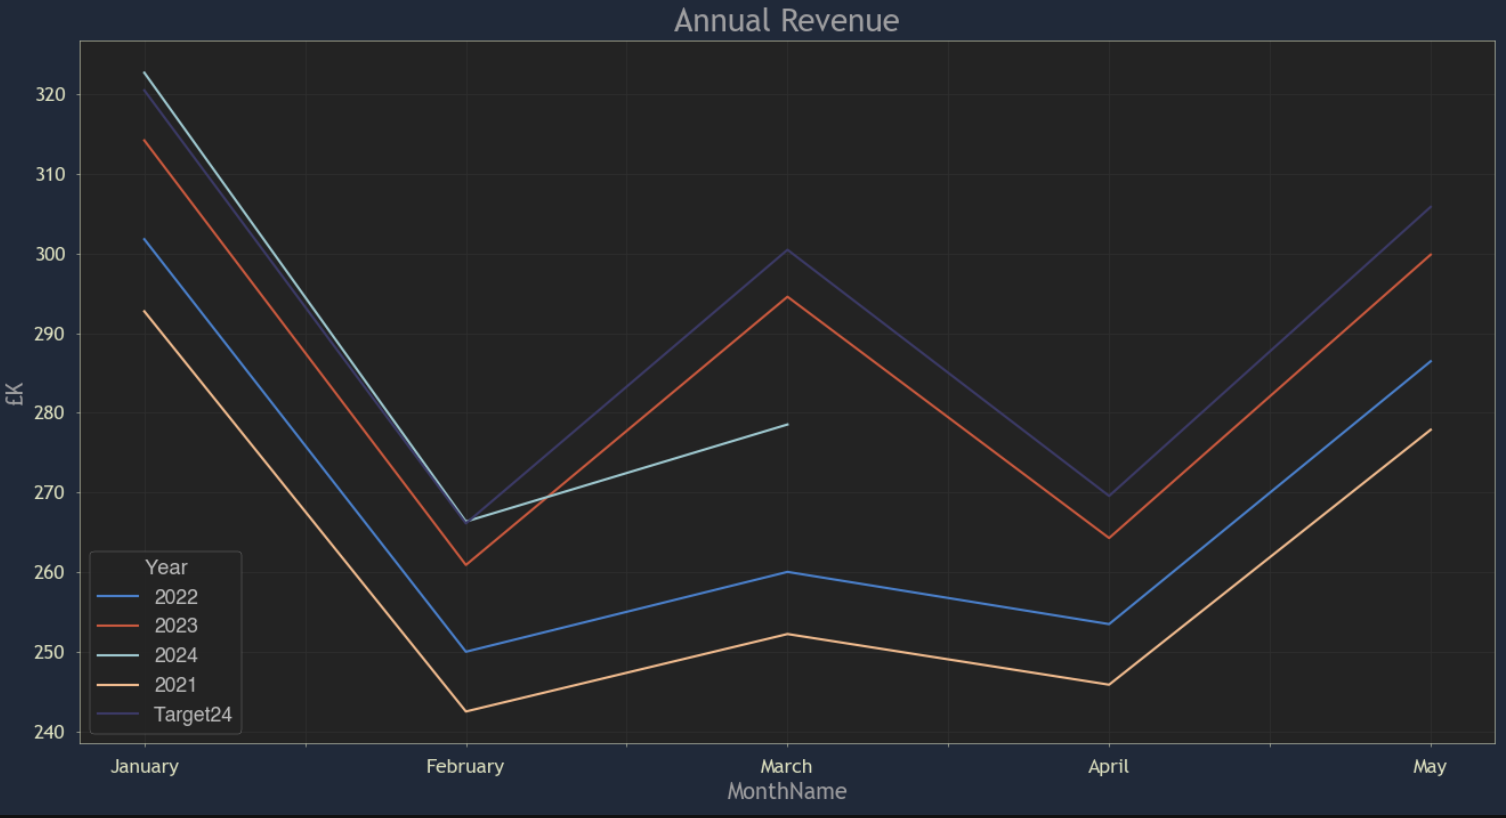
This highlights that gradient for 2024 is similar to 2021/22. So this is starting to feel like 2023 is an anomaly. But remember that we identified this problem as the revenue figure being below March’s target. Let’s add the target in.

Judging from the shape of the 2024 target line, mirroring the 2023 line, it is clearly based on the 2023 figures with an uplift. Applying an uplift to prior year’s figures is quite a widespread practice in business and whilst the annual financial planning process might be looking closely at sales trends, we all know that everybody is always under pressure at year end in the race to get the new targets published. Basing targets on 2023 automatically creates the expectation of a peak in March 24.
Armed with this broader view, can we answer the original question of whether we have missed the March 2024 revenue target? Unfortunately, not quite. But we have the basis for a rich discussion that will lead to the answer:
- Is the March 23 revenue peak a specific change that we believe we can replicate every March?
- Can we find out the cause?
- Do we believe that the March 2024 target should be based on the 2023 peak?
I hope I’ve illustrated how just a few simple numbers can, in reality, hide a depth of complexity that is likely to be missed with a simple viewing. There’s nothing complex in the analysis here, but it illustrates how broadening context provides a perspective to see new things.
I’ll explore this further in the next post in this series.
Alex Loveless and Pete Hodge discuss the challenges and application of using Large Language Models for the practise of data analysis.
In this video Pete Hodge uncovers the secrets behind setting challenging yet realistic business targets for the year ahead. Discover the power of historical trend analysis and visualisation to gain a deeper understanding of your metrics. He delves into the nuances of peak and trough patterns across different years and shows how forecasts can feed actionable plans through data-driven insights.
Alex Loveless and Pete Hodge discuss the value of test & learn strategies for creating value and mitigating risk when deploying commercial and operations strategy.
Transcript
[00:00:00] Alex: we’ve done our exploration, some evaluation. We’ve got some insight and really it’s about either checking that insight or we’re actually into the action stage. You know, we’re evolving and we want to, we want to look and change something. And it’s following. the similar cycle in terms of Agile that we do during exploration.
[00:00:24] Pete: So it’s an iterative process. And what we want to do is pick off small parts to do, and we are learning in that. And the reason why you do small bits to test, take action, and then learn from the results is you want to minimize your risk. There’s always going to be a risk in any change. And you want to minimise that risk.
At the same time you want to maximise your learning. So you want to not only make the change, but there’s no guarantee that any change you make is going to work. So you want to minimise impacts of the change, do enough so that you can get a measure from it, and get your learnings, and then rinse and repeat.
[00:01:04] Alex: So have you got any examples in mind?
[00:01:06] Pete: This is probably something you’ve done before, you know, and you’ve got a number of choices of how to do it. And what we would advocate here is choosing a segment of your customer base and, you know, a variety of prices that you might want to charge. And you’d break those out and test each one individually against, a small segment as opposed to just putting your prices up for everybody and see what sticks.
There’s obviously always risks with putting prices up. And if you can segment your customers in a way that, you can separate them out, then you can start to see which ones are going to work.
[00:01:44] Alex: So the risk is that you put the prices up for everyone, which is going to be quicker.
And obviously in that case, you’re getting more money coming in, right?
[00:01:56] Pete: you’ve got the risk element, so straight away take a bit more time and you’re reducing your risk. The flip side is the learn side.
If you put your prices up and everything seems tickety boo, that’s great. What you’ve learned is that your market can sustain a higher price. Okay, could it have sustained an even higher price? We don’t know, you know, if you’re, if you were ticketing something, for example, and you increase your your prices by two pound a ticket, and there was absolutely no drop off in the number of tickets you were selling, you would go great.
But could you have sustained three pounds? Could it have been four pounds? Will the market sustain six pounds, ten pounds? You don’t know. The only way you’re going to know. Is you’ve got to do another 2 and what you keep doing that until you get to the point where people drop off
so, yes it’s quicker but you don’t learn as much. With a smaller test and learn, you would look to maybe even make the increment smaller and certainly a smaller number of customers. . Now you’re not affecting your whole customer base. Equally, you might then say, well, it worked for this segment of customers. Now try it for these ones. And because you’ve segmented out and you’ve got smaller chunks, you’re seeing and you’re learning whether each of them will sustain it, or what you might find is a small group, did move away.
So you get to learn a lot more, which of course is great for when you want to put prices up again in a year, two years time, you’ve got a much better starting point for which part of your customer base will, will sustain that, that price increase.
[00:03:31] Alex: Yeah. So I think by putting your price up across the board you might have by doing that have changed the, the, makeup of your, your market, your customer base. And therefore, because you put the price up, you’ve, you’ve sort of nudged into a different, demographic perhaps.
Is that what you wanted? And by pricing the lower bracket out Did you want to do that? And, and could you not have both audiences? And is there a medium price point that you could, you could hit that would , please, , everybody and increase your overall base while improving your income?
Pricing for markets is way more complicated than this, but I think that the, the core point remains that if you stratify your test and you target it properly, you get to use it as a method of data generation that will allow you then to apply much more nuanced pricing strategies going forward.
[00:04:31] Pete: So I think the stratification is the real key point. You can start to make, you know, Very targeted tests, and you’re going to learn very targeted things. And as you say, you start to focus on that and do some analysis around that. And that’s going to get you thinking about some of the other risks, which might not be so apparent.
[00:04:50] Alex: The vast majority of the things you’re saying actually relate less to the, in this case, the price increases themselves and a certain business strategy and more about data and information generation and and learning from that.
So it it’s not just about testing and learning, what you’re actually doing is generating more data about your business and your customers that you would not otherwise have had. And, that should be considered gold dust. It should be handled properly, analyzed properly, and understood properly, both in the context of the test that you’re running, i. e. higher prices, but what else have you learned from that? And what can you infer From what you’ve learned from that that you may be tested on a certain segment You know people who like football, right? And they were much less tolerant of the price increase than people who like snooker right Do you act on that?
Right, do you say, but I’m gonna charge snooker fans more, right? Maybe, I don’t know, but maybe not. But the point is you’ve lost nothing. What you’ve gained is information and if you’re a betting company, perhaps, that’s really valuable.
So the implication is that businesses are testing and learning all the time, right? Or rather they are taking actions and through either active analysis or through general Consumption of of information they are learning things,
And really what we’re not talking about here is changing fundamentally, , the way that your business operates. It’s by taking processes that are already . happening to some degree and putting them in a an environment and an analytical framework that will allow them to be meaningfully and accurately measured. So we create an environment whereby we can solicit a behaviour. But we may never repeat that action again, even if it was successful, right? We might just do things to , the customer, that are, are simply to generate information.
There’s all sorts of things you can do just to solicit behavior from the customer that will allow us to learn something that will ratchet us up to a much bigger goal.
[00:07:09] Alex: So sort of a a hierarchy of hypotheses as it were.
Alex Loveless and Pete Hodge explore what a data proof of concept is and the advantages to businesses that use them.
Pete Hodge and Alex Loveless dig further into the job of getting to first insights as quickly as possible, what works and the pitfalls
Pete Hodge and Alex Loveless discuss why you need to get beyond a dashboard to get insights on KPIs and other business metrics
Pete Hodge and Alex Loveless talk about how to analyse data at speed and why databases tend to slow the process
Pete Hodge and Alex Loveless talk about why it’s important to work iteratively with business customers when doing analysis
Alex Loveless and Pete Hodge discuss the need to understand business context before diving into the data lake.
Alex Loveless and Pete Hodge discuss Alex’s blog post on the nature of exploration, curiosity and discovery and how this relates to using data to analyse and diagnose problems with your business.
Why we explore
The urge to explore is hardwired into the human psyche. Wherever there’s a blank spot on the map, we need to go find out what, if anything, is there. Why? Because, that’s why. But often the answer to the “why?” is “because we might find something useful/exciting/valuable there”. The key word here is “might”. We had a good idea what would find in the Americas or on the moon, but we didn’t know. The point was to find out, and have a bunch of fun while doing so (and hopefully not dying!).

It’s obviously essential to know generally where you’re heading, what you might find there and why that’s significant, but once you set sail, it’s best to stay pretty open minded. What if Columbus has returned from the Americas and told Ferdinand and Isabella “we didn’t find what we thought so we just came home, but here’s a potato”? The point was discovery. (We’ll set aside the fact that Columbus was somewhat confused about what he found and refused to ever admit he was wrong) . What he brought back was knowledge. A wealth of information that would inform new voyages and the eventual genesis of the new world.
Pick your direction
So how does this look in the present time, and minus the wooden ships and scurvy? First it’s important to pick your direction, which involves setting some hypotheses based on what you already know about your business. Some examples:
- Margins are low because delivery costs have crept up and you’ve not adjusted prices
- Sales are low because the new CRM system is not being used properly
- Conversion is flat due to sub-optimal campaign messaging
Observe how those sentences are constructed: problem because reason. It’s important to state your analytical objectives this way because “find out why conversion is flat” is too woolly and open ended and will likely result in spending a bunch of time aimlessly sailing barren waters never spotting land. Why set out sailing to go “over there somewhere” when you actually already have a pretty good idea where land is? You understand your business, so use that understanding.
Set sail with an open mind
Having set out a clear hypothesis we’ve got somewhere very specific to look and a reason to do so. In addition to this we have a simple question to answer. Are creeping delivery costs the source of your margin woes? Yes or no? This is where things get really interesting, because the answer is almost always something like “somewhat” or “not no, but not yes either”.
You may think that’s a terrible place to find yourself, but think of what we’ve learned to get there. If it’s not costs then what is it? To have got to that conclusion, you’ve had to explore some adjacent waters that you weren’t expecting to find yourself in - competitors, productions costs, efficiency - and we can really start to get to the core of the problem. Of course a simple “yes” answer would have been more convenient, but reality cares about as much for your need for convenience as sea cares about your need for stable ground and a decent cup of coffee!

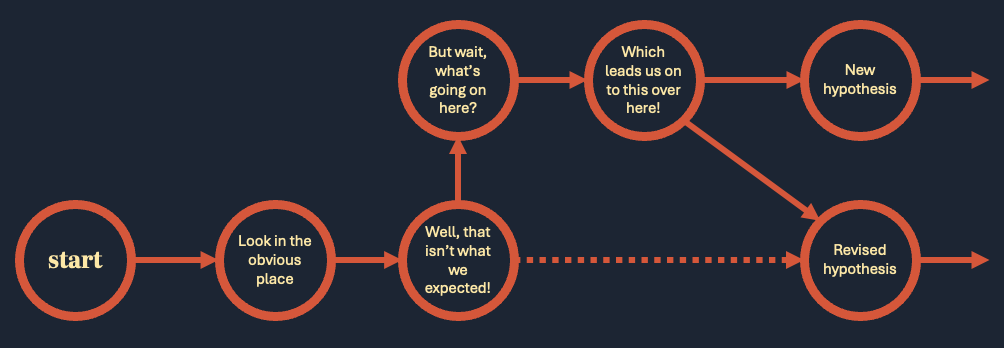
We often find that when we start our partnership of discovery with a client that, although the hypotheses we created as a group pointed in the right direction, what we found was not what we expected. This should never be an end point! The process of analysis is always a journey. If getting to the right answers was that easy, then we’d never need to look - it would be obvious! What you discover might not be what you expect, but it’s usually what you actually need to know.
