Navigating KPIs: A Tale of Missed Targets and Strategic Insights
You knew it was coming, but this doesn’t make it any less disappointing: the March sales target was missed. And so starts the chain of events - email the head of Operations, give them a day to get the numbers together, have the discussions, agree the resulting actions to make up the revenue through the rest of the year, agree the narrative, review next month.
But does all of that ‘busy’ work really need to happen? Was the target really missed or was the target unrealistic? I want to use this example of an everyday business report and how it is interpreted to show how spending a little time understanding the numbers first can save ballooning hours chasing your tail down the line.
This is effectively a toy example with some straightforward analysis, but it’s the first in a series of posts that explores how using time series data provides a superior view when planning and reviewing KPI’s. Here we start with a familiar view and how it might be flawed. Let’s dive in.

Here you see an excerpt from a typical monthly report. Looking at the March revenue figures, Current Year Revenue is over £20k below target. Not good. In fact you can also see that this year’s revenue is even below last year’s. Given this information you’d be forgiven for thinking there is a problem. But before you fire off that email to ops, let’s broaden the context a little to include prior months.
If we look at January and February we can see both targets have been met, and this is confirmed with the Revenue % of Target being positive. However, there is a 7% drop in February. Perhaps this is a downward trend and it’s accelerating? Let’s zoom out again.

Wow, things are getting a little busy here. I wanted to show the figures from 2022 (seen as 2023 Prior Year) for the relevant months and it’s already a sea of numbers. The reality is you would normally have the remaining 2023 months as columns as well! Whilst I know we all have to deal with larger reports and dashboards like this I can feel your eyes glazing over… so. So let’s shift to a graphical representation.

A simple shift like this pays off handsomely and is a step we always take in our analysis. A picture paints a thousand words, right?
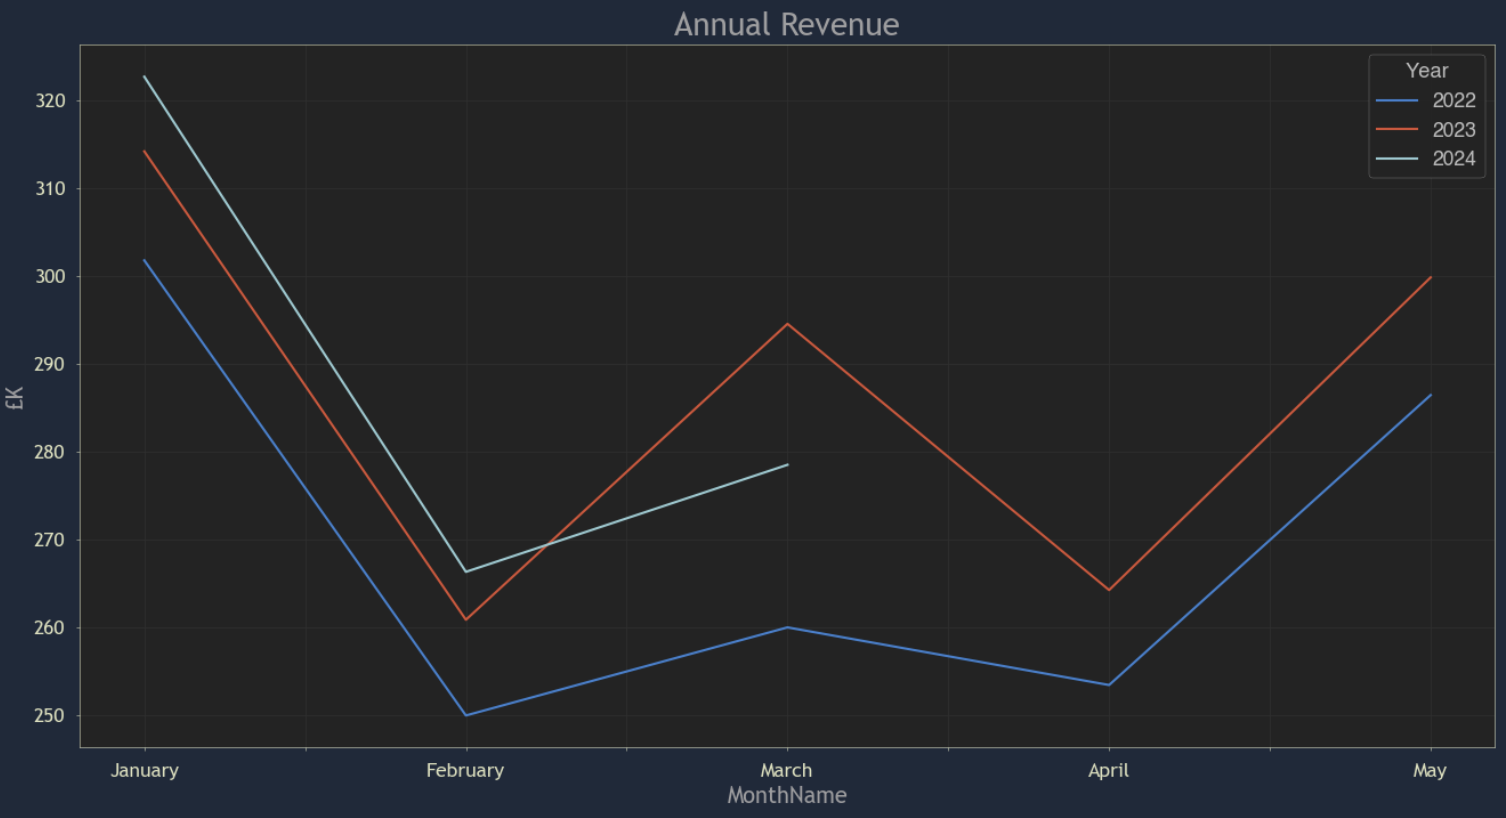
Now it’s easier to see that March 2023 has a steeper line from February than the same in 2024 or 2022. So we have one out of three data points being higher which isn’t enough to make a sound judgement. How to fix this? You guessed it, let’s zoom out again by adding another year.

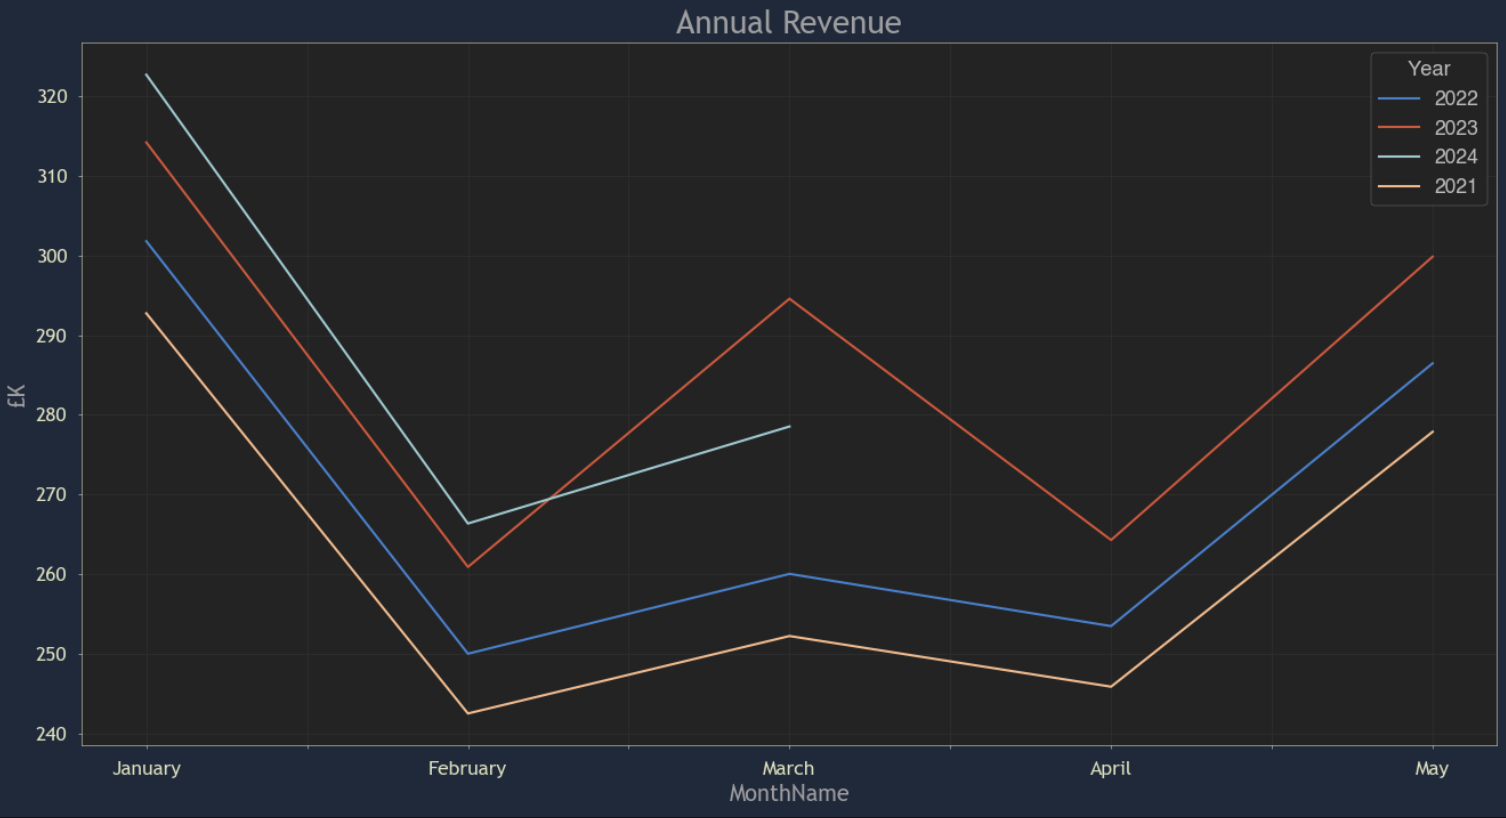
This highlights that gradient for 2024 is similar to 2021/22. So this is starting to feel like 2023 is an anomaly. But remember that we identified this problem as the revenue figure being below March’s target. Let’s add the target in.

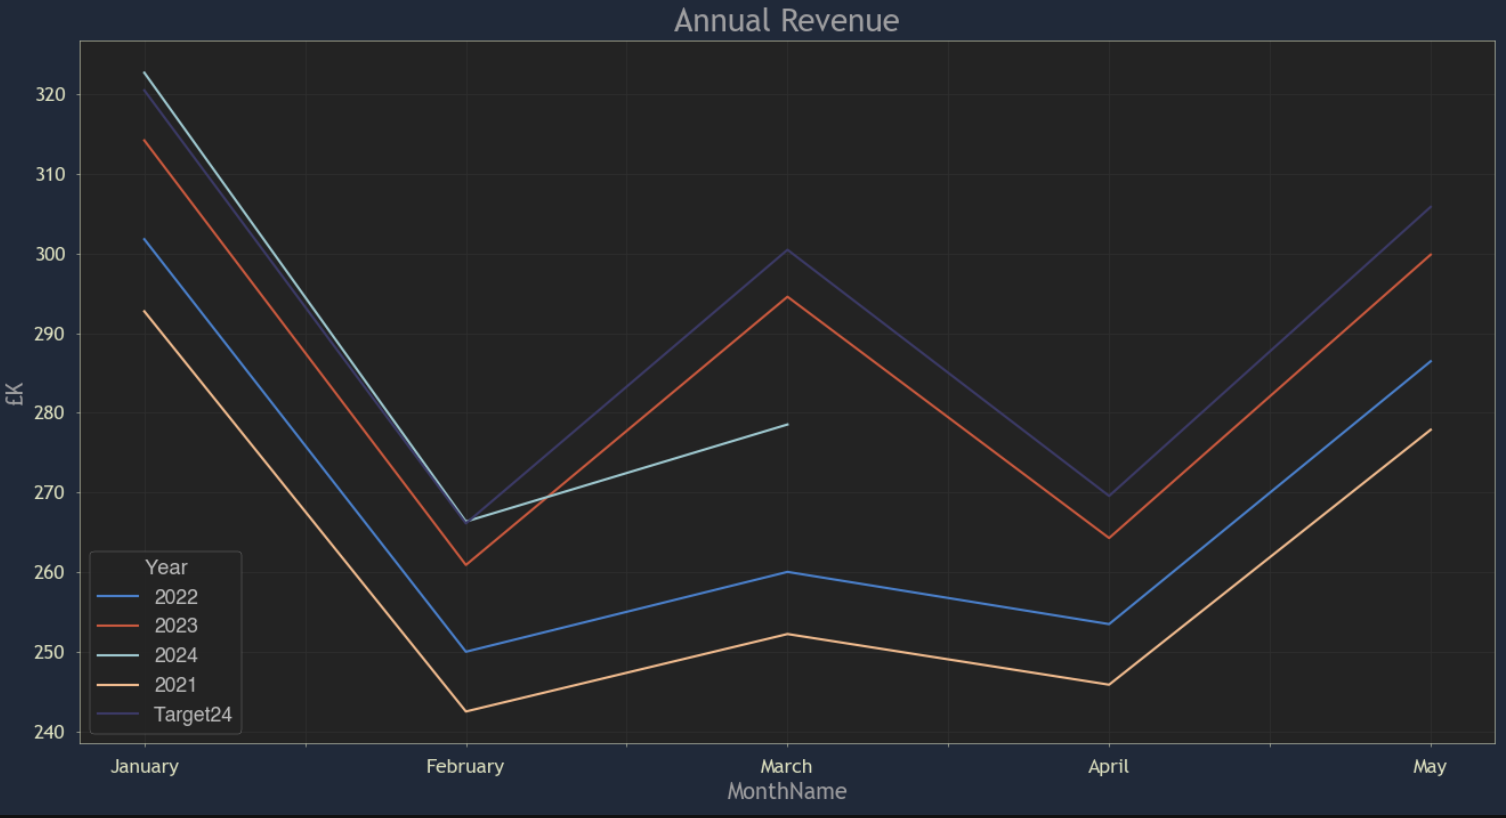
Judging from the shape of the 2024 target line, mirroring the 2023 line, it is clearly based on the 2023 figures with an uplift. Applying an uplift to prior year’s figures is quite a widespread practice in business and whilst the annual financial planning process might be looking closely at sales trends, we all know that everybody is always under pressure at year end in the race to get the new targets published. Basing targets on 2023 automatically creates the expectation of a peak in March 24.
Armed with this broader view, can we answer the original question of whether we have missed the March 2024 revenue target? Unfortunately, not quite. But we have the basis for a rich discussion that will lead to the answer:
- Is the March 23 revenue peak a specific change that we believe we can replicate every March?
- Can we find out the cause?
- Do we believe that the March 2024 target should be based on the 2023 peak?
I hope I’ve illustrated how just a few simple numbers can, in reality, hide a depth of complexity that is likely to be missed with a simple viewing. There’s nothing complex in the analysis here, but it illustrates how broadening context provides a perspective to see new things.
I’ll explore this further in the next post in this series.
